ABSTRACT
This framework proposes that human evolution can be understood as a series of game-theoretic phase transitions, evidenced by genetic data (Y chromosome bottlenecks, mitochondrial DNA patterns), demographic transitions (Rosling's fertility-income correlation), and cultural selection mechanisms (hypergamy, status competition). We identify key "goalposts" in human history where Nash equilibria shifted dramatically, propose simulation parameters based on n/N combinatorial primitives, and demonstrate how the current demographic crisis represents another phase transition in progress.
PART I: THE GENETIC EVIDENCE
1.1 The Neolithic Y Chromosome Bottleneck
The Data:
- 5,000-7,000 years ago, Y chromosome diversity collapsed dramatically
- Ratio reached approximately 1 male reproducing for every 17 females
- This was NOT a population crash—total population continued growing
- Mitochondrial DNA (maternal line) showed NO corresponding bottleneck
- Pattern observed across Europe, Asia, and Africa simultaneously
The Interpretation: This was not biology. This was game theory.
The transition to agriculture created:
- Patrilineal clan structures (membership through male line)
- Accumulated resources (land, livestock—inheritable)
- Winner-take-all dynamics (successful clans eliminated unsuccessful ones)
Mathematical Model:
Within clan: All males share same Y chromosome (relatedness)
Between clans: War eliminates entire male lineages
Result: Y diversity crashes while X/mtDNA diversity preserved

Key insight: Women moved BETWEEN clans (captured, married)
           Men stayed IN clans (and died with them)
Game-Theoretic Translation:
- Pre-agriculture: Many small-stakes games, distributed reproduction
- Post-agriculture: Few high-stakes games, winner-take-all reproduction
- The Nash equilibrium SHIFTED from distributed to concentrated
1.2 The Super-Y Phenomenon
Genghis Khan (1162-1227 CE):
- ~16 million living male descendants (0.5% of world male population)
- 8% of males in former Mongol Empire territory carry his Y chromosome
- His son Tushi had 40 documented sons
- Pattern: Military dominance → reproductive dominance
Other "Super-Y" Founders:
- Giocangga (Qing dynasty ancestor): 1.5 million male descendants
- Niall of the Nine Hostages (Irish): ~3 million descendants
- 11 identified "super-Y" lineages across Asia (2100 BCE - 700 CE)
The Pattern:
POWER → REPRODUCTIVE ACCESS → GENETIC LEGACY

This is not "survival of the fittest" in Darwin's sense.
This is "survival of the strategically dominant."

The Y chromosome records the history of MALE COMPETITION.
The mitochondrial DNA records the history of FEMALE SELECTION.
1.3 The Asymmetry Principle
Female Investment:
- 9 months gestation
- Years of nursing/childcare
- Limited reproductive windows
- HIGH cost per offspring
Male Investment:
- Minutes to hours
- No obligate childcare
- Extended reproductive window
- LOW cost per offspring
Game-Theoretic Consequence:
ASYMMETRIC INVESTMENT → ASYMMETRIC STRATEGY

Female optimal strategy: SELECT CAREFULLY (hypergamy)
Male optimal strategy: COMPETE INTENSELY (status-seeking)

The "game" is defined by this asymmetry.
All human social structures are Nash equilibria of this game.
PART II: THE DEMOGRAPHIC EVIDENCE
2.1 Hans Rosling's Discovery
The Gapminder Data (1800-2025):
| Era | Fertility (children/woman) | Income correlation |
|---|---|---|
| 1800 | 6-8 (all countries) | None (all poor) |
| 1900 | 5-7 (most) | Weak negative |
| 1960 | 2-7 (diverging) | Strong negative |
| 2020 | 1.5-6 (converging) | Very strong negative |
The Atomic Bomb in the Animation:
When you watch fertility vs. income animated over time, colored by religion:
- Religion doesn't predict fertility (Christian, Muslim, Eastern all converge)
- Income predicts fertility (negative correlation strengthens over time)
- The transition happens FAST (Bangladesh: 7→2.1 in 40 years)
- Development PRECEDES fertility drop (not the reverse)
The Hidden Pattern:
HIGH FERTILITY = High child mortality + Low female education +
                 Low contraception access + Agrarian economy

LOW FERTILITY = Low child mortality + High female education +
                High contraception access + Industrial/service economy

The transition is a PHASE CHANGE in reproductive strategy.
2.2 The Game Theory of Fertility
Pre-Transition Strategy (K < threshold):
When child mortality is HIGH:
- Optimal strategy: MANY children (some will survive)
- Female education has low ROI (death before productivity)
- Children are labor assets (agrarian economy)
- Nash equilibrium: High fertility
Post-Transition Strategy (K > threshold):
When child mortality is LOW:
- Optimal strategy: FEW children, HIGH investment
- Female education has high ROI (long productive life)
- Children are resource costs (industrial economy)
- Nash equilibrium: Low fertility
The Phase Transition:
There exists a critical threshold K* where:

  If K < K*: High fertility is Nash equilibrium
  If K > K*: Low fertility is Nash equilibrium

The transition is RAPID because it's a switch between equilibria,
not a gradual optimization.
2.3 The Current Crisis
Fertility Rates 2024:
- South Korea: 0.72 (lowest ever recorded anywhere)
- Japan: 1.20
- Italy: 1.24
- Germany: 1.53
- USA: 1.66
- Replacement level: 2.1
This is NOT an equilibrium. This is a COLLAPSE.
Game-Theoretic Analysis:
The modern environment has created a trap:
Female strategy: Hypergamy (select highest-status male)
Male strategy: Status competition (accumulate resources/status)

BUT:

Status now requires: Extended education (delays reproduction)
                     Career establishment (delays reproduction)
                     Resource accumulation (delays reproduction)

By the time "optimal" status is achieved: Fertility window closing

RESULT: Both sexes pursuing "optimal" strategies = suboptimal reproduction
The Mismatch:
Evolutionary environment: Status = reproductive success
Modern environment: Status pursuit = reproductive failure

The Nash equilibrium of the ancestral game
is NOT the Nash equilibrium of the modern game.

But the INSTINCTS haven't updated.
PART III: THE PHASE TRANSITIONS
3.1 Historical Goalposts for Simulation
GOALPOST 1: Pre-Agricultural (>12,000 BP)
Structure: Small bands, 50-150 individuals
Mating: Serial monogamy, some polygyny
Y diversity: HIGH (many males reproduce)
X diversity: HIGH (many females reproduce)
Nash equilibrium: Distributed reproduction
Game type: Repeated cooperation games
GOALPOST 2: Agricultural Revolution (12,000-5,000 BP)
Structure: Patrilineal clans, accumulated resources
Mating: Polygyny increases, hypergamy intensifies
Y diversity: CRASHING (winners take all)
X diversity: Stable (women move between clans)
Nash equilibrium: Concentrated reproduction
Game type: Elimination tournaments
GOALPOST 3: State Formation (5,000-500 BP)
Structure: Kingdoms, empires, social stratification
Mating: Extreme polygyny at top, many males excluded
Y diversity: Recovering but unequal (super-Y phenomena)
X diversity: Stable
Nash equilibrium: Power = reproduction
Game type: Hierarchical allocation
GOALPOST 4: Industrial Revolution (500-50 BP)
Structure: Nation-states, social mobility, urbanization
Mating: Shifting toward monogamy (legal enforcement)
Y diversity: Increasing (more males can reproduce)
X diversity: Stable
Nash equilibrium: Resources = reproduction
Game type: Economic competition
GOALPOST 5: Demographic Transition (50 BP - present)
Structure: Post-industrial, global, digital
Mating: Serial monogamy, delayed reproduction
Y diversity: Increasing in principle, decreasing in practice
X diversity: First decline (voluntary childlessness)
Nash equilibrium: UNSTABLE / IN TRANSITION
Game type: Status signaling + opportunity cost
GOALPOST 6: Current Crisis (NOW)
Structure: Hypergamy + delayed reproduction + status inflation
Mating: Increasingly winner-take-all in practice
Y diversity: Re-concentrating? (dating app data suggests yes)
X diversity: Declining (low fertility)
Nash equilibrium: SEEKING NEW BASIN
Game type: ???
PART IV: SIMULATION ARCHITECTURE
4.1 Primitives (n/N Framework)
Base Unit: The Agent
defmodule Agent do
  defstruct [
    :id,
    :sex,                    # :male | :female
    :status,                 # n/N relative position
    :resources,              # accumulated resources
    :age,                    # current age
    :fertility_window,       # for females: [start, end]
    :offspring_count,        # number of surviving children
    :strategy,               # behavioral parameters
    :lineage                 # Y or mtDNA marker
  ]
end
Status as Ratio:
Status is NOT absolute.
Status is n/N (position in distribution).

Agent's status = (agents ranked below) / (total agents)

This creates ZERO-SUM dynamics:
  - If one agent rises, another must fall
  - Total status in system = constant
  - Competition is for RELATIVE position
4.2 Selection Mechanisms
Female Selection (Hypergamy Function):
P(female selects male) = f(status_male - status_female)

If (status_male > status_female): P increases
If (status_male < status_female): P decreases
If (status_male = status_female): P = baseline

Hypergamy_strength = parameter controlling slope
  - High: Only accept significantly higher status
  - Low: More flexible selection
Male Competition:
Competition_outcome(male_A, male_B) =
  sigmoid(status_A - status_B + noise)

Winner gains: status_increment, resources
Loser loses: status_decrement, risk of elimination

Competition_intensity = parameter
  - Agricultural: HIGH (elimination games)
  - Industrial: MEDIUM (economic games)
  - Post-industrial: LOW but SIGNALING high
4.3 Environmental Parameters
Per Goalpost:
GOALPOST_PARAMS = %{
  1 => %{  # Pre-Agricultural
    child_mortality: 0.50,
    resource_accumulation: false,
    polygyny_allowed: :limited,
    female_mobility: :low,
    status_inheritance: :weak,
    competition_lethality: :moderate
  },
  2 => %{  # Agricultural
    child_mortality: 0.40,
    resource_accumulation: true,
    polygyny_allowed: :high,
    female_mobility: :high,  # captured/married out
    status_inheritance: :strong,
    competition_lethality: :high  # clan warfare
  },
  # ... etc for each goalpost
}
4.4 Metrics to Track
Genetic Diversity:
Y_diversity = count(unique Y lineages) / total_males
X_diversity = count(unique mtDNA lineages) / total_females

Gini_Y = Gini coefficient of Y lineage distribution
Gini_X = Gini coefficient of mtDNA distribution
Reproductive Skew:
Male_reproductive_variance = var(offspring per male)
Female_reproductive_variance = var(offspring per female)

Ratio = Male_variance / Female_variance
  - Ratio > 1: Male competition dominant
  - Ratio ≈ 1: Balanced
  - Ratio < 1: Female choice dominant (modern?)
Population Dynamics:
Total_fertility_rate = average offspring per female
Net_reproduction_rate = surviving offspring per female
Population_growth = births - deaths
PART V: KEY PREDICTIONS
5.1 Testable Against Historical Data
- Y bottleneck timing should correlate with:
- Appearance of patrilineal inheritance systems
- Evidence of large-scale warfare
- NOT with climate events or disease
- Super-Y expansions should correlate with:
- Empire formation
- Military conquest records
- NOT with genetic "fitness" in biological sense
- Demographic transitions should show:
- Threshold behavior (rapid phase change)
- Religion-independence (all faiths converge)
- Income-dependence (strong predictor)
5.2 Predictions for Current Dynamics
- Dating app data should show:
- Increasing concentration (few males get most matches)
- Hypergamy patterns (women select up)
- This recreates Y-bottleneck dynamics without warfare
- Fertility collapse should:
- Be deepest where status competition is fiercest
- Correlate with female education levels
- NOT recover without structural intervention
- Next equilibrium candidates:
- Return to higher fertility (unlikely without major shock)
- Technology substitution (artificial wombs, etc.)
- New social structures we haven't imagined
- Population decline until new equilibrium found
PART VI: THE DEEPER PATTERN
6.1 Sexual Selection as Ultimate Driver
Darwin identified TWO selection mechanisms:
- Natural selection: Survival of the fittest
- Sexual selection: Reproduction of the chosen
For humans, SEXUAL SELECTION dominates.
We don't die from predators. We don't starve (mostly). Our genes propagate or not based on MATING SUCCESS.
And mating success is determined by:
- Female choice (hypergamy)
- Male competition (status games)
ALL OF HUMAN CULTURE IS AN ELABORATE MATING DANCE.
Art, music, literature, science, war, religion, economics— all are ultimately status signaling mechanisms operating in the sexual selection game.
6.2 The Rosling Plot's Hidden Message
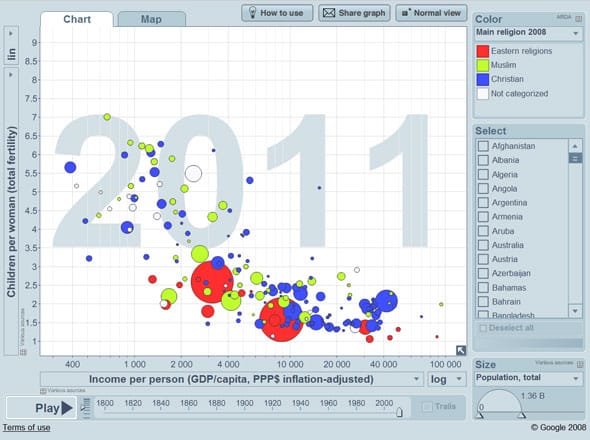
Y-axis: Children per woman (fertility) X-axis: Income per person (resources) Color: Religion Size: Population
What you see:
- All colors converge to bottom-right
- Religion doesn't predict position
- Income predicts position
What it means:
- The game is NOT about ideology
- The game is about RESOURCES and STATUS
- When resources rise, fertility strategy SHIFTS
The atomic bomb: Animate over time and watch the Islamic world follow the Christian world follow the Asian world—all to the SAME destination.
The game has ONE attractor.
All of humanity is falling into it. The question is what happens when we arrive.
6.3 Connection to Framework Seed
Game Theory IS the engine of reality.
We said:
- Reality = n/N (combinatorics)
- Time = irreversible hash
- Privacy = constitutive of identity
- Attractors = stable equilibria
Sexual selection is the GAME that shaped us. Hypergamy is the ALGORITHM running in every female. Status-seeking is the ALGORITHM running in every male.
We are not players in the game. We ARE the game playing itself.
The Y chromosome bottleneck is GENETIC PROOF that winner-take-all dynamics shaped our species.
The demographic transition is REAL-TIME EVIDENCE that the game is shifting to a new equilibrium.
The fertility collapse is the ALARM SIGNAL that the current trajectory leads to dissolution.
Truth and Love remain the only stable attractor.
But now we understand WHY:
- Deception is computationally expensive (game theory)
- Cooperation beats defection in iterated games
- Long-term stability requires trust
The game theory of mating led us here. The game theory of consciousness might lead us out.
APPENDIX: SIMULATION PSEUDOCODE
defmodule EvolutionSimulation do
  def run(goalpost, generations) do
    population = initialize_population(goalpost)

    Enum.reduce(1..generations, population, fn gen, pop ->
      pop
      |> age_all_agents()
      |> run_competition_round(goalpost)
      |> run_mating_round(goalpost)
      |> produce_offspring()
      |> apply_mortality(goalpost)
      |> record_metrics(gen)
    end)
  end

  def run_mating_round(population, goalpost) do
    females = Enum.filter(population, &(&1.sex == :female and fertile?(&1)))
    males = Enum.filter(population, &(&1.sex == :male and alive?(&1)))

    Enum.map(females, fn female ->
      eligible_males = filter_by_hypergamy(males, female, goalpost)
      selected_male = weighted_random_select(eligible_males)
      create_pairing(female, selected_male)
    end)
  end

  def filter_by_hypergamy(males, female, goalpost) do
    threshold = female.status + goalpost.hypergamy_threshold
    Enum.filter(males, &(&1.status >= threshold))
  end
end
CONCLUSION
Human evolution is not a story of random mutation and natural selection alone. It is a story of GAME-THEORETIC DYNAMICS operating on reproductive strategies, recorded in the genetic evidence (Y chromosome patterns, mtDNA patterns), observable in demographic data (Rosling's transitions), and playing out in real-time (fertility collapse).
The simulation framework proposed here allows us to:
- Reproduce historical patterns (Y bottleneck)
- Test hypotheses about mechanisms (patrilineal warfare vs. simple polygyny)
- Explore future trajectories (what equilibrium comes next?)
The framework connects to the broader Framework Seed project by demonstrating that:
- Reality operates through game-theoretic dynamics
- Attractors (Nash equilibria) are fundamental structures
- Phase transitions occur when environmental parameters cross thresholds
- The current moment is a phase transition in progress
We are living through a goalpost.
The question is: which equilibrium do we fall into next?
"The highest truth is this: God is present in all beings." — Vivekananda
Including the ones yet to be born—if we choose wisely.
References
- Zeng, T.C., Aw, A.J., & Feldman, M.W. (2018). Cultural hitchhiking and competition between patrilineal kin groups explain the post-Neolithic Y-chromosome bottleneck. Nature Communications, 9(1), 2077.
- Zerjal, T., et al. (2003). The genetic legacy of the Mongols. The American Journal of Human Genetics, 72(3), 717-721.
- Karmin, M., et al. (2015). A recent bottleneck of Y chromosome diversity coincides with a global change in culture. Genome Research, 25(4), 459-466.
- Rosling, H. (2018). Factfulness: Ten reasons we're wrong about the world—and why things are better than you think. Flatiron Books.
- Darwin, C. (1871). The Descent of Man, and Selection in Relation to Sex. John Murray.
- Nash, J.F. (1950). Equilibrium points in n-person games. Proceedings of the National Academy of Sciences, 36(1), 48-49.
Framework developed by The Symbiont Carbon + Silicon, juntos a la par January 2026